NYSED calls the August 5 figures preliminary and expects to publish final, district-level data in early November. Until then, the newest public numbers for 12 Onondaga County districts are from 2024-25, and they track poverty closely.
Statewide proficiency on New York’s grades 3-8 English language arts tests fell to 48 percent in 2025-26 from 53 percent in 2024-25, while math rose to 57 percent from 55 percent and science to 47 percent from 44 percent, according to preliminary results and comparison charts the State Education Department released on August 5, 2026. NYSED calls the figures preliminary until districts verify them. District-level results for Syracuse-area schools are not public yet.
This story came from public records we pulled ourselves
Get the next one, plus overnight incidents, in your inbox at 6 AM. Free, no spam.
Why it matters: the number every parent will search for, how their own district did, does not exist in public form. NYSED sent the preliminary data to schools and districts, and its release says “the public release of all final state assessment data is anticipated for early November.” As of September 26, 2026, the newest year on NYSED’s data site for any Central New York district is 2024-25.
How did New York’s 2025-26 scores change by grade?
NYSED’s release charts put the preliminary 2025-26 figures next to the actual 2024-25 and 2023-24 results. CNY Signal calculated the point changes from those charts.
| Grade | ELA 2024-25 | ELA 2025-26 (preliminary) | ELA change | Math 2024-25 | Math 2025-26 (preliminary) | Math change |
|---|---|---|---|---|---|---|
| 3 | 54% | 43% | down 11 | 60% | 60% | flat |
| 4 | 54% | 48% | down 6 | 59% | 62% | up 3 |
| 5 | 57% | 43% | down 14 | 54% | 55% | up 1 |
| 6 | 51% | 50% | down 1 | 51% | 53% | up 2 |
| 7 | 51% | 51% | flat | 56% | 60% | up 4 |
| 8 | 52% | 53% | up 1 | 47% | 47% | flat |
| Grades 3-8 | 53% | 48% | down 5 | 55% | 57% | up 2 |
Science, given in grades 5 and 8, went from 45 to 46 percent in grade 5 and from 44 to 49 percent in grade 8.
The ELA drop is concentrated in grades 3 through 5. Grades 6 through 8 were within a point of last year. The grades 3-8 ELA figure is still above the 46 percent of 2023-24. NYSED’s written statement in the release says the “preliminary results show a significant decline in statewide English Language Arts performance for some grade levels compared with the prior year” and that the department “will conduct a detailed analysis.”
Can 2025-26 be compared with 2024-25?
Yes, according to NYSED. Its document “Key Facts About the 2026 State Assessment Results” says the 2026 tests “measure the same state learning standards that guided instruction and assessment in the prior year,” and that for grades 3-8 ELA and math, “scale scores can be compared across each administration since 2023,” when the tests were rebuilt around the Next Generation standards. Science is comparable since 2024. The same document says changes in results “do not, on their own, indicate that the assessment was made easier or more difficult.”
When will Syracuse-area district scores be public?
NYSED says the preliminary data went to schools and districts to give families information on their own children’s results and to plan instruction for 2026-27. After districts check their data, NYSED will update its reports, with public release of final data anticipated in early November. CNY Signal checked data.nysed.gov on September 26, 2026: the district profile pages and the downloads page top out at 2024-25. Nothing in the tables below is a 2025-26 figure.
The 2024-25 baseline for 12 Onondaga County districts
Districts are listed alphabetically, not ranked. “Proficient” is NYSED’s term for scoring Level 3 or 4 on its four-level scale. Math totals follow NYSED’s report card, which includes grade 7 and 8 students who took a Regents exam instead of the grade-level test. The poverty column is NYSED’s “economically disadvantaged” count, students who take part, or whose families take part, in programs such as free or reduced-price lunch, as a share of 2024-25 K-12 enrollment.
| District | Students tested, ELA | ELA proficient | Math proficient | Economically disadvantaged, share of K-12 |
|---|---|---|---|---|
| Baldwinsville | 2,186 | 58% | 58% | 32% |
| East Syracuse Minoa | 1,184 | 48% | 49% | 47% |
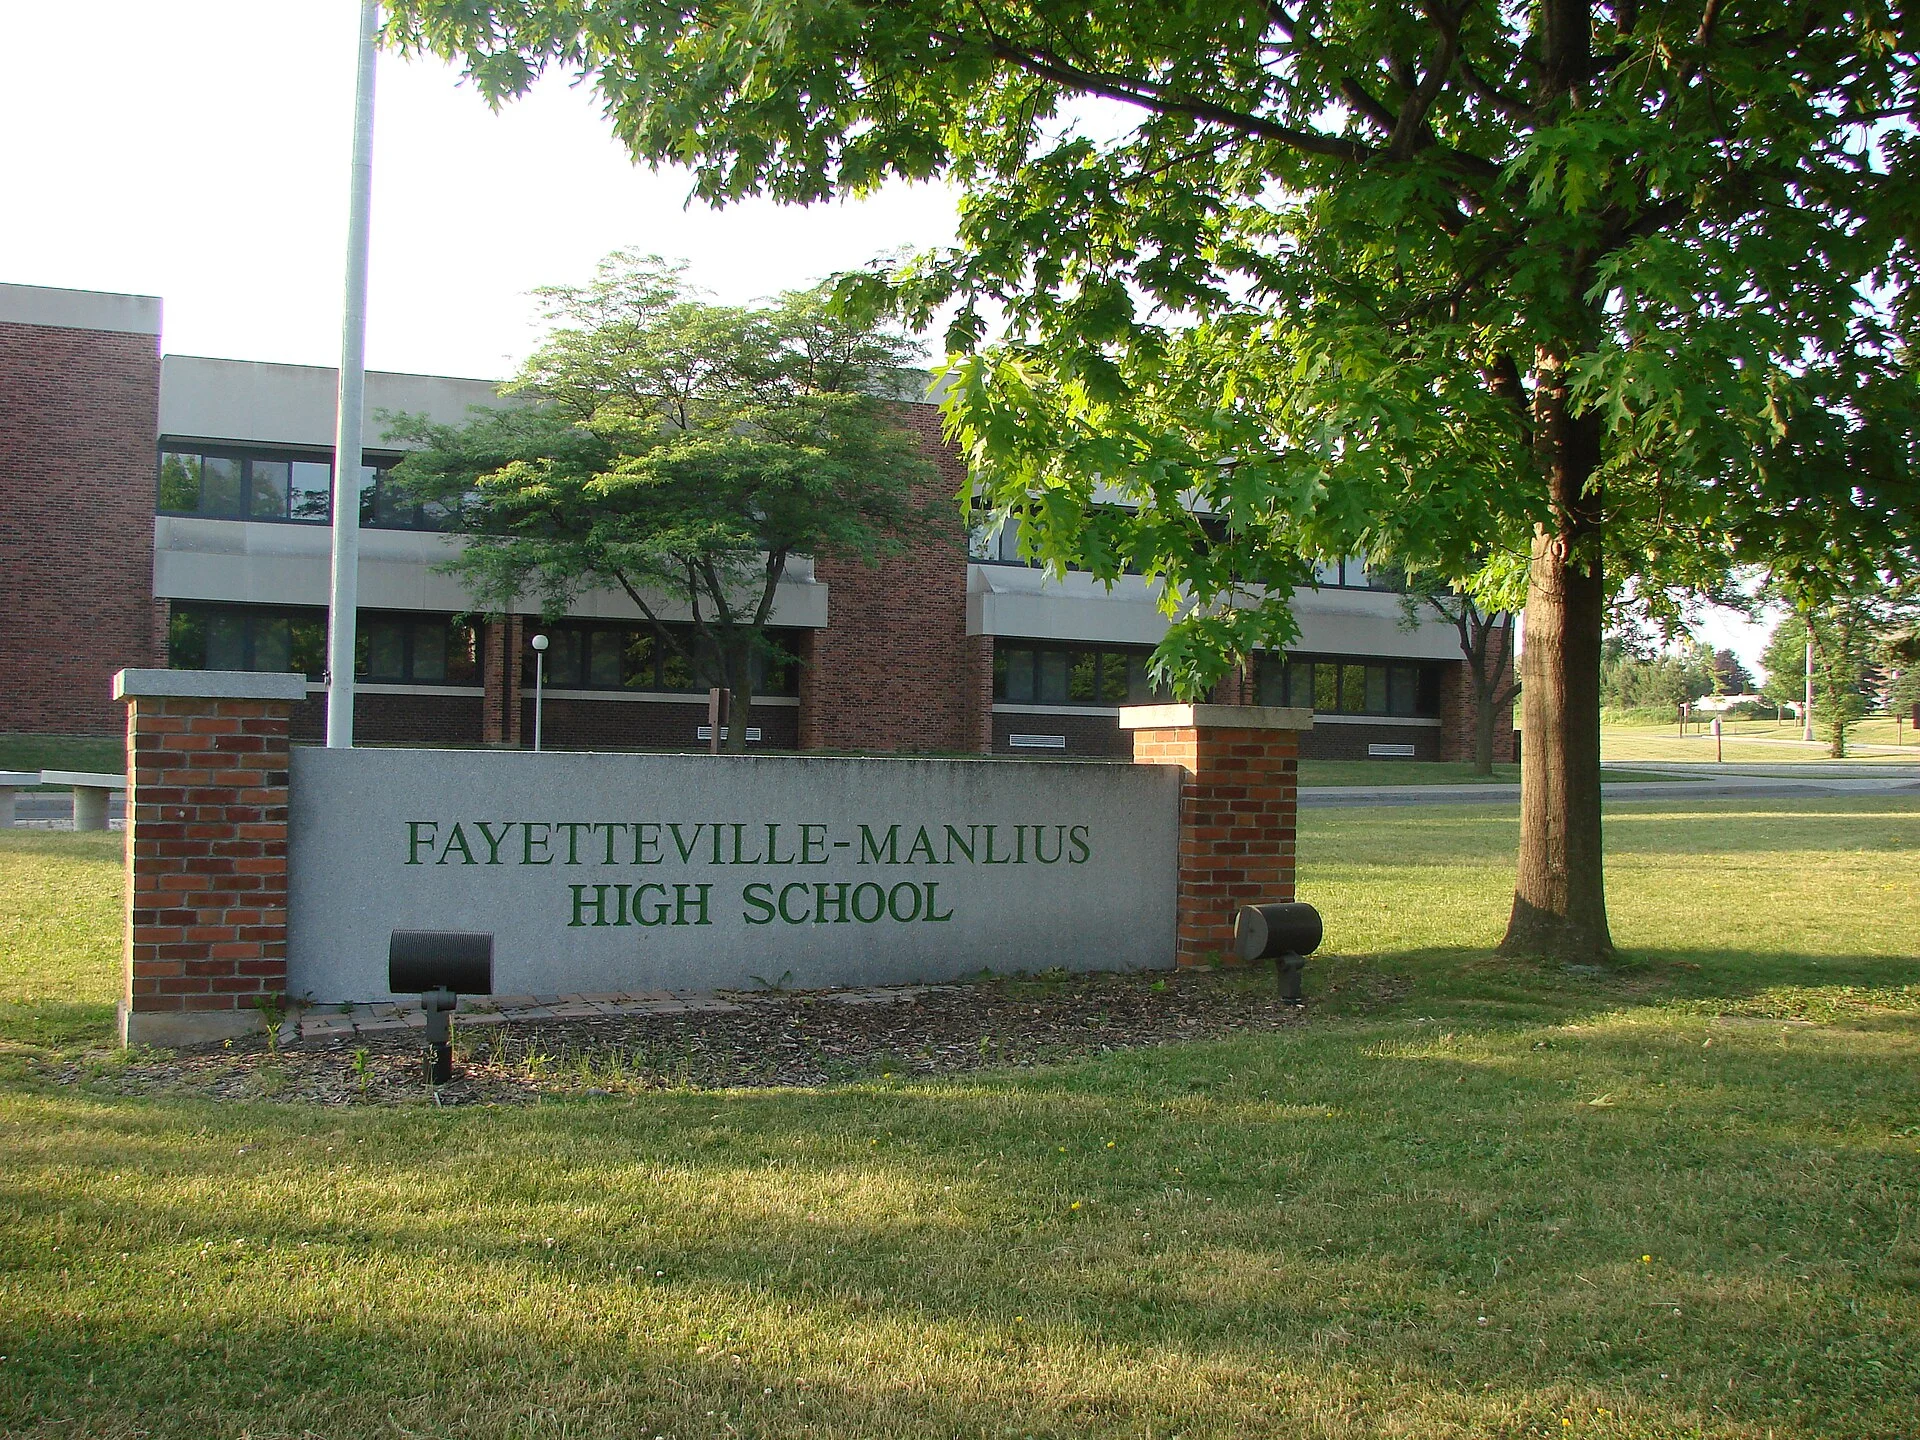
| Fayetteville-Manlius | 1,820 | 78% | 84% | 19% |
| Jamesville-DeWitt | 928 | 74% | 76% | 29% |
| Liverpool | 2,813 | 47% | 54% | 46% |
| Marcellus | 550 | 67% | 75% | 25% |
| North Syracuse | 3,161 | 42% | 52% | 43% |
| Skaneateles | 467 | 72% | 80% | 14% |
| Solvay | 474 | 36% | 39% | 68% |
| Syracuse City | 7,308 | 24% | 20%* | 90% |
| West Genesee | 1,913 | 60% | 66% | 29% |
| Westhill | 703 | 52% | 64% | 32% |
| New York State | 937,417 | 53% | 57% | 60% |
*NYSED blanks Syracuse’s combined math figure on its report card. Its published rule suppresses data that would reveal the results of a group of fewer than five students, and Syracuse’s grade 7 Regents group had three. CNY Signal calculated 20 percent from the grade-level rows on the same page: 1,523 to 1,526 proficient of 7,677 tested.
Size matters when reading this. Syracuse tested 7,308 students in ELA; Skaneateles tested 467. One student moves Skaneateles’ rate by about 0.2 points and Syracuse’s by about 0.01.
The pattern is the reason the poverty column is there. The three districts with the smallest poverty shares, Skaneateles, Fayetteville-Manlius and Marcellus, have the three highest ELA rates. The two with the largest, Syracuse and Solvay, have the two lowest.
Inside each district, the same gap
The cleanest way to see how much poverty shapes a district’s number is to split each district’s own students. CNY Signal summed the grade 3 through 8 ELA rows for economically disadvantaged students and for everyone else on each district’s 2024-25 report card.
| District | Econ. disadvantaged students tested | Proficient | All other students tested | Proficient |
|---|---|---|---|---|
| Baldwinsville | 660 | 40% | 1,526 | 65% |
| East Syracuse Minoa | 530 | 36% | 654 | 58% |
| Fayetteville-Manlius | 337 | 60% | 1,483 | 82% |
| Jamesville-DeWitt | 232 | 50% | 696 | 82% |
| Liverpool | 1,298 | 36% | 1,515 | 56% |
| Marcellus | 130 | 50% | 420 | 72% |
| North Syracuse | 1,402 | 29% | 1,759 | 52% |
| Skaneateles | 64 | 50% | 403 | 76% |
| Solvay | 309 | 29% | 165 | 49% |
| Syracuse City | 6,567 | 20% | 741 | 58% |
| West Genesee | 538 | 40% | 1,375 | 67% |
| Westhill | 212 | 34% | 491 | 59% |
| New York State | 561,374 | 44% | 376,043 | 67% |
Two things follow. A district’s overall rate rises and falls with how many of its students are poor. And inside every one of the 12 districts, economically disadvantaged students scored well below their classmates: a gap of about 20 points in Solvay and Liverpool, 23 points statewide, and 38 points in Syracuse.
One more number from the same page. Syracuse’s 741 tested students who are not economically disadvantaged were 58 percent proficient in ELA, above the statewide all-student rate of 53 percent. Its 6,567 economically disadvantaged students were at 20 percent. The district’s 24 percent is the blend of those two groups, and the first is small.
Sources
- State Education Department Releases Preliminary Data on English Language Arts, Mathematics and Science State Exams, NYSED, August 5, 2026 (release text and grade-by-grade comparison charts). https://www.nysed.gov/news/2026/state-education-department-releases-preliminary-data-english-language-arts-mathematics-and
- Key Facts About the 2026 State Assessment Results, NYSED (PDF linked from the release). https://www.nysed.gov/sites/default/files/key-facts-about-the-2026-state-assessment-results.pdf
- New York State Report Card 2024-25, grades 3-8 ELA and mathematics, NYSED Data Site. https://data.nysed.gov/essa.php?year=2025&state=yes&38ELA=1&38MATH=1&createreport=1
- New York State enrollment data 2024-25, NYSED Data Site. https://data.nysed.gov/enrollment.php?year=2025&state=yes
- Report Card Glossary and Guide 2024-25 (definitions of proficient, economically disadvantaged, suppression rules), NYSED Data Site. https://data.nysed.gov/files/essa/24-25/glossary.pdf
- Downloadable data files page (newest year 2024-25 as of September 26, 2026), NYSED Data Site. https://data.nysed.gov/downloads.php
- Baldwinsville CSD 2024-25 report card and enrollment, NYSED Data Site. https://data.nysed.gov/essa.php?year=2025&instid=800000041004&38ELA=1&38MATH=1&createreport=1 and https://data.nysed.gov/enrollment.php?year=2025&instid=800000041004
- East Syracuse Minoa CSD 2024-25 report card and enrollment, NYSED Data Site. https://data.nysed.gov/essa.php?year=2025&instid=800000041101&38ELA=1&38MATH=1&createreport=1 and https://data.nysed.gov/enrollment.php?year=2025&instid=800000041101
- Fayetteville-Manlius CSD 2024-25 report card and enrollment, NYSED Data Site. https://data.nysed.gov/essa.php?year=2025&instid=800000040971&38ELA=1&38MATH=1&createreport=1 and https://data.nysed.gov/enrollment.php?year=2025&instid=800000040971
- Jamesville-DeWitt CSD 2024-25 report card and enrollment, NYSED Data Site. https://data.nysed.gov/essa.php?year=2025&instid=800000041078&38ELA=1&38MATH=1&createreport=1 and https://data.nysed.gov/enrollment.php?year=2025&instid=800000041078
- Liverpool CSD 2024-25 report card and enrollment, NYSED Data Site. https://data.nysed.gov/essa.php?year=2025&instid=800000040959&38ELA=1&38MATH=1&createreport=1 and https://data.nysed.gov/enrollment.php?year=2025&instid=800000040959
- Marcellus CSD 2024-25 report card and enrollment, NYSED Data Site. https://data.nysed.gov/essa.php?year=2025&instid=800000040953&38ELA=1&38MATH=1&createreport=1 and https://data.nysed.gov/enrollment.php?year=2025&instid=800000040953
- North Syracuse CSD 2024-25 report card and enrollment, NYSED Data Site. https://data.nysed.gov/essa.php?year=2025&instid=800000055803&38ELA=1&38MATH=1&createreport=1 and https://data.nysed.gov/enrollment.php?year=2025&instid=800000055803
- Skaneateles CSD 2024-25 report card and enrollment, NYSED Data Site. https://data.nysed.gov/essa.php?year=2025&instid=800000040919&38ELA=1&38MATH=1&createreport=1 and https://data.nysed.gov/enrollment.php?year=2025&instid=800000040919
- Solvay UFSD 2024-25 report card and enrollment, NYSED Data Site. https://data.nysed.gov/essa.php?year=2025&instid=800000041022&38ELA=1&38MATH=1&createreport=1 and https://data.nysed.gov/enrollment.php?year=2025&instid=800000041022
- Syracuse City School District 2024-25 report card and enrollment, NYSED Data Site. https://data.nysed.gov/essa.php?year=2025&instid=800000040902&38ELA=1&38MATH=1&createreport=1 and https://data.nysed.gov/enrollment.php?year=2025&instid=800000040902
- West Genesee CSD 2024-25 report card and enrollment, NYSED Data Site. https://data.nysed.gov/essa.php?year=2025&instid=800000041152&38ELA=1&38MATH=1&createreport=1 and https://data.nysed.gov/enrollment.php?year=2025&instid=800000041152
- Westhill CSD 2024-25 report card and enrollment, NYSED Data Site. https://data.nysed.gov/essa.php?year=2025&instid=800000041013&38ELA=1&38MATH=1&createreport=1 and https://data.nysed.gov/enrollment.php?year=2025&instid=800000041013
Every figure in this story is drawn from the records above. Links go to the primary documents.