From Onondaga Creek’s channelized corridor to the low-lying underpasses that trap drivers every summer, here’s where the water goes when the sky opens up — and why some neighborhoods bear the burden more than others.
It takes about 45 minutes. That’s roughly how long a serious thunderstorm needs to turn certain parts of Syracuse from functioning city into obstacle course. Water climbs curbs, fills underpasses to windshield height, backs sewage into basements, and turns creeks that most residents forget exist into angry brown torrents hauling everything that isn’t bolted down toward Onondaga Lake.
If you’ve lived here long enough, you know the spots. You know to avoid the low points on Erie Boulevard when the radar goes red. You know Onondaga Creek can jump from lazy trickle to federal flood stage in a few hours. What you might not know is why certain neighborhoods flood and others don’t — and how a century of infrastructure decisions, some of them deeply inequitable, built the flood map Syracuse lives with today.
This is that map.
The South Side: Where the Creek and the History Run Deep
Start with Onondaga Creek. It’s the spine of Syracuse’s flood story, running roughly 17 miles from the hills south of the city through the Onondaga Nation, into the heart of the South Side, under downtown, and out to Onondaga Lake. The Army Corps of Engineers built a flood control dam on Onondaga Nation land in 1949 — a 543-meter earthen structure that created a reservoir with 18,200 acre-feet of capacity. It was designed to protect the city. It was imposed on the Nation without meaningful consent, flooding homes and land that had been inhabited for centuries.
South of downtown, the creek flows through a heavily channelized corridor. At Spencer Street, the channel is deep enough that even a 100-year flood wouldn’t overtop the constructed banks — the floodplain drawn by FEMA there is razor-thin. But channelization is a bargain with the devil: it moves water faster downstream, which means the problem doesn’t disappear. It just shows up somewhere else, faster.
In August 2016, the City of Syracuse mailed postcards to 876 homeowners, mostly on the South and Southwest sides, informing them that revised FEMA flood maps had placed their properties inside a flood zone. That meant a new mandate: purchase flood insurance, at an estimated cost of $225 to $900 per year, with the potential for 18 percent annual increases. The same map revision removed 237 homes from flood zones — most of them in the Meadowbrook neighborhood on the city’s more affluent East Side, where newer detention infrastructure had been built.
The CNY Solidarity Coalition has documented this disparity in detail. Syracuse’s South Side is home to the highest concentration of poverty among Black and Hispanic residents of any major metro area in the country. These are the same neighborhoods where the 15th Ward was razed for the I-81 viaduct in the late 1950s, where residents were relocated into housing that now sits in a flood zone. The water follows the contours of the land. The policy follows older contours entirely.
Syracuse Watershed Flood Risk Index
The West Side: Harbor Brook’s Hidden Threat
Harbor Brook doesn’t get the attention Onondaga Creek does, but it should. This tributary drains 12.1 square miles of Syracuse’s West Side — flowing, improbably, through a culvert directly beneath the Carrier Dome — before emptying into Onondaga Creek and ultimately Onondaga Lake. Its main constituents are stormwater runoff and treated wastewater. During heavy rain, it becomes a primary conduit for combined sewer overflows.
The West Side’s flooding problem is less about dramatic creek overflows and more about what happens underground. Syracuse, like many Northeastern cities built in the 19th century, runs a combined sewer system that carries both stormwater and raw sewage in the same pipes. When rainfall exceeds capacity — and it doesn’t take a biblical event to do it — the system is designed to release the overflow into the nearest waterway. Harbor Brook and Onondaga Creek are the release valves. The result: raw sewage in the creek, in the lake, and sometimes backed up into the basements of homes in the Clinton and Harbor Brook sewersheds.
The county’s Save the Rain program, which has made Syracuse a nationally recognized model for green stormwater infrastructure, has targeted the Harbor Brook corridor specifically. A constructed wetland pilot project now captures and treats approximately 14.8 million gallons of combined sewage annually. Ninety-eight green infrastructure projects funded through the Green Improvement Fund capture more than 48.5 million gallons of runoff per year across the Clinton, Harbor Brook, and Midland combined sewersheds. The $78 million investment in green infrastructure manages stormwater from 470 acres of developed land.
It’s working. But it hasn’t erased the risk. The Near Westside, around West Onondaga Street, remains in the active flood management zone, and residents in the sewershed still face basement flooding during the kind of intense summer storms that climate models say are coming more often.
The East Side: Meadowbrook’s Quiet Success (and Remaining Gaps)
Meadowbrook Creek on the East Side is a different story — one that shows what targeted investment can do, and who benefits when it arrives.
The Meadowbrook Detention Basin, adjacent to Barry Park, is the centerpiece of the East Side’s flood control infrastructure. The basin stores excess stormwater during heavy rain events and releases it slowly, reducing peak flows downstream. The Friends of Barry Park and the Westcott Neighborhood Association have pushed for years to get the detention basin officially recognized as both a park amenity and a piece of critical infrastructure — a dual identity that keeps it maintained and funded.
The investment paid a measurable dividend: those 237 homes removed from FEMA flood maps in 2016 were concentrated here, in the Meadowbrook neighborhood along Meadowbrook Drive. For those homeowners, that meant the end of mandatory flood insurance payments. The contrast with the South Side, where 876 homes were simultaneously added to the flood zone, is the starkest illustration of how infrastructure spending — and the lack of it — literally redraws the map of who bears the financial burden of living in a flood-prone city.
The North Side: Ley Creek and the Flat-Land Problem
North of downtown, the terrain flattens out. And flat land floods differently — it doesn’t drain.
The Ley Creek watershed, stretching through the towns of DeWitt and Clay and into the northern reaches of the city, is notoriously sluggish. Water moves slowly across the flat topography toward Onondaga Lake, and when heavy rain hits developed land with hardened, channelized streams, the runoff has nowhere to go. Standing water and basement flooding are chronic issues, not just emergency events.
In August 2023, a storm system dropped between six and eight inches of rain on the northern part of Onondaga County in a matter of hours. Interstate 81 was closed between Cicero and Brewerton for more than eight hours as floodwater disabled vehicles on the highway. The Moyers Corners Fire Department in Clay responded to 60 calls in seven hours, the vast majority for residents with two to three feet of water in their basements. The ceiling at Great Northern Mall partially collapsed. Official rainfall at Hancock Airport recorded just under two and a half inches — but radar estimates showed the real deluge had concentrated north of the city, in the Ley Creek and Clay corridors, where the flat land acted like a bathtub.
The Town of DeWitt has launched a Ley Creek Watershed abatement project targeting the problem with tree planting, rain barrels, French-drain storm drains, retention and detention ponds, and stream de-channelization. It’s a long game. The underlying issue — decades of development on flat land with inadequate stormwater planning — doesn’t reverse quickly.
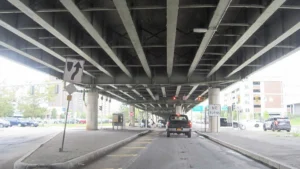
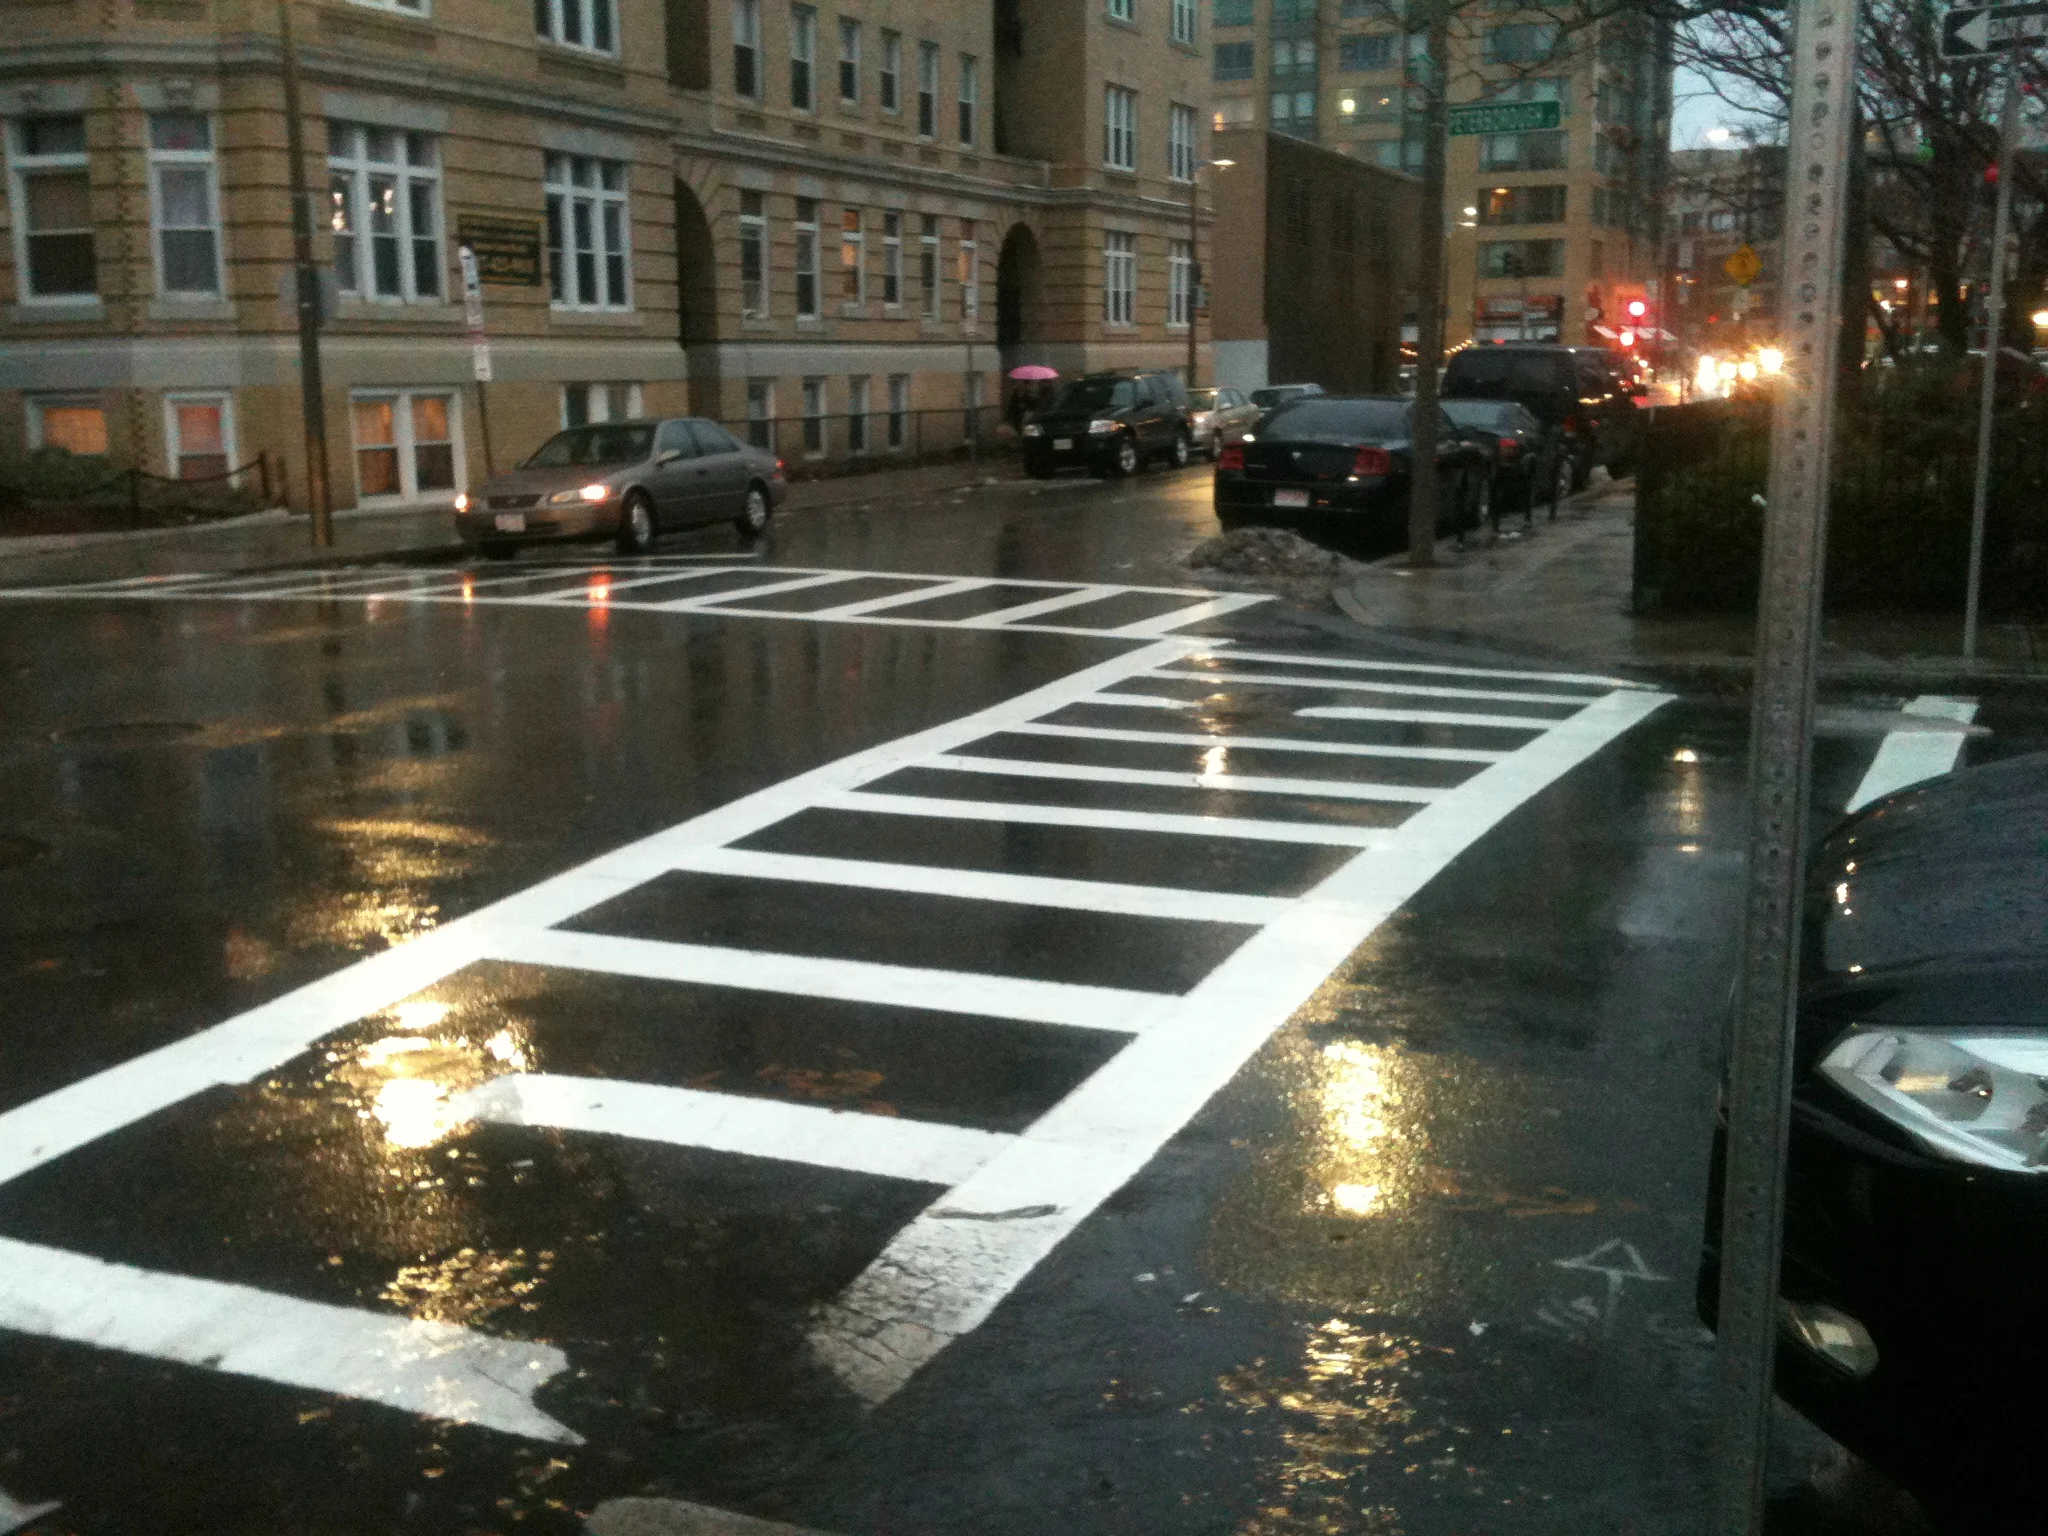
The Underpasses and Low Points: Where Drivers Get Trapped
Every flash flood season, Syracuse’s low points claim vehicles. The locations are predictable, and yet people keep driving into them.
The Teall Avenue and Grant Boulevard intersection near Shop City Plaza is one of the most reliable flood traps in the city. In 2015, heavy overnight rain turned the intersection into a lake, stranding vehicles and requiring emergency response crews. The area sits at a natural low point where surface runoff converges, and the aging storm drains can’t keep pace with intense rainfall.
Erie Boulevard East, particularly near Midler Avenue, floods with disturbing regularity during summer storms. The road sits in a former marshland corridor — the old Erie Canal route — and the grade works against it. When the system backs up, Erie Boulevard collects water like a trough.
The underpasses along the railroad corridors — where streets dip beneath CSX rail lines — are the most dangerous. These engineered low points fill with water almost instantly during heavy rain, and the depth is impossible to gauge from a vehicle approaching at speed. Just six inches of fast-moving water can knock a person off their feet. Twelve inches can float a car. The underpasses routinely reach two to three feet.
Syracuse Underpass Flood Closure Frequency
Butternut Creek and the Suburban East: DeWitt’s Recurring Headache
East of the city, Butternut Creek has its own flood history. The creek, a tributary of Limestone Creek in the Oneida Lake watershed, carved national headlines in 2012 when the Butternut Creek aqueduct breached, draining a large section of the Old Erie Canal and sending flash flooding down the creek corridor in DeWitt.
During the floods of 1974, Butternut Creek crested at a record 7.84 feet, flooding portions of DeWitt. The state channelized several sections of the creek during the construction of Interstate 481 in the 1970s to provide flood control — the same channelization strategy applied to Onondaga Creek, with the same downstream trade-offs. The area from the CSX railroad crossing to the Old Erie Canal remains flood-susceptible, and the New York State Department of Environmental Conservation selected the Butternut Creek watershed as a study site for its Resilient NY Flood Mitigation Initiative.
The Numbers Behind the Water
Syracuse’s flood risk is not theoretical. According to First Street Foundation’s climate risk analysis, 17 percent of buildings in the city face significant flood risk. Those buildings average a 34 percent chance of experiencing a flood of roughly 1.1 feet over a 30-year period. Twelve of the city’s 109 census tracts have more than half their buildings at significant risk from both surface (pluvial) and riverine (fluvial) flooding.
Precipitation risk in Syracuse is rated extreme. Climate projections indicate that the share of rainfall arriving in intense, short-duration bursts — the kind that overwhelm storm sewers and fill underpasses — is increasing. Syracuse already receives approximately 40 inches of precipitation annually, but it’s the distribution that matters: a slow, steady rain over 12 hours is manageable. Two inches in 45 minutes is a disaster.
Onondaga County has roughly 800 combined sewer overflow outfalls as part of the statewide total, and the metropolitan areas of Syracuse, New York City, Buffalo, and Albany account for 74 percent of all CSO outfalls in New York State. The county’s green and gray infrastructure investments — including the $78 million in green projects and the 6.5-million-gallon Clinton CSO Storage Facility beneath downtown — were designed to capture 95 percent of annual rainfall volume. That’s an extraordinary engineering achievement. But the remaining five percent, arriving in the most intense storms, is still enough to flood basements, close highways, and send sewage into creeks.
INFOGRAPHIC: CNY’s Top 10 Flash Flood Hotspots
See designer specifications below
INFOGRAPHIC: Flash Flood by the Numbers
See designer specifications below
Syracuse Flash Flooding By The Numbers
Onondaga County (2000-2024)
Special Flood Hazard Areas
events since 1990
declarations (flooding)
flash flood conditions
to underpass flooding
What Changes — and What Doesn’t
Onondaga County has invested more aggressively in stormwater management than almost any comparable metro area in the country. The Save the Rain program, launched after former County Executive Joanie Mahoney paused traditional gray infrastructure construction to explore green alternatives, has become a national model. Jacobs, the engineering firm managing the program since 2008, has overseen more than 200 green stormwater infrastructure projects. The county was one of the first in the nation to achieve Federal CSO Consent Order closure — a legal milestone that means it met the terms of its agreement with the EPA to reduce combined sewer overflows.
But the underlying geography doesn’t change. Syracuse sits in a bowl. Creeks that were once wide, meandering floodplains have been straightened and hardened into channels. Development has paved over the land that once absorbed rainfall. And the climate is shifting: extreme precipitation events are becoming more frequent across the Northeast, delivering more water in shorter windows than the system — even the upgraded system — was designed to handle.
The neighborhoods that flood are, disproportionately, the neighborhoods that have always flooded. And they are, disproportionately, the neighborhoods where the people with the fewest resources live. That’s not a weather problem. That’s an infrastructure investment problem with a very long memory.
INFOGRAPHIC: What To Do When Water Rises
See designer specifications below
Know Before the Water Rises
Flash floods move faster than emergency broadcasts. By the time a warning hits your phone through the Wireless Emergency Alert system, roads may already be impassable. The best defense is knowing your neighborhood’s risk before the storm — knowing which intersections collect water, which routes home cross a floodplain, and which basement walls have wept before.
Bookmark these resources:
- City of Syracuse Floodplain Maps: syr.gov/Departments/Engineering/Floodplains — includes interactive maps for Onondaga Creek, Harbor Brook, and Meadowbrook.
- NWS Onondaga Creek Gage: weather.gov/nerfc/ondn6 — real-time creek level and flood category data.
- FEMA Flood Map Service Center: msc.fema.gov — look up your property’s flood zone designation.
- Onondaga County 911: 315-435-2525 (non-emergency flood reporting)
- Emergency: 911
Get Real-Time Flood Alerts for Your Neighborhood
CNY Signal monitors weather, emergency dispatch, and road conditions around the clock. When flash flooding hits your area, you’ll know before you’re stuck in it.