NOAA records show the shortfall was almost entirely a July and August problem, and it followed a dry 2025, something that has happened only twice before since 1950. Federal and state drought trackers currently list Onondaga County as normal, not in drought.
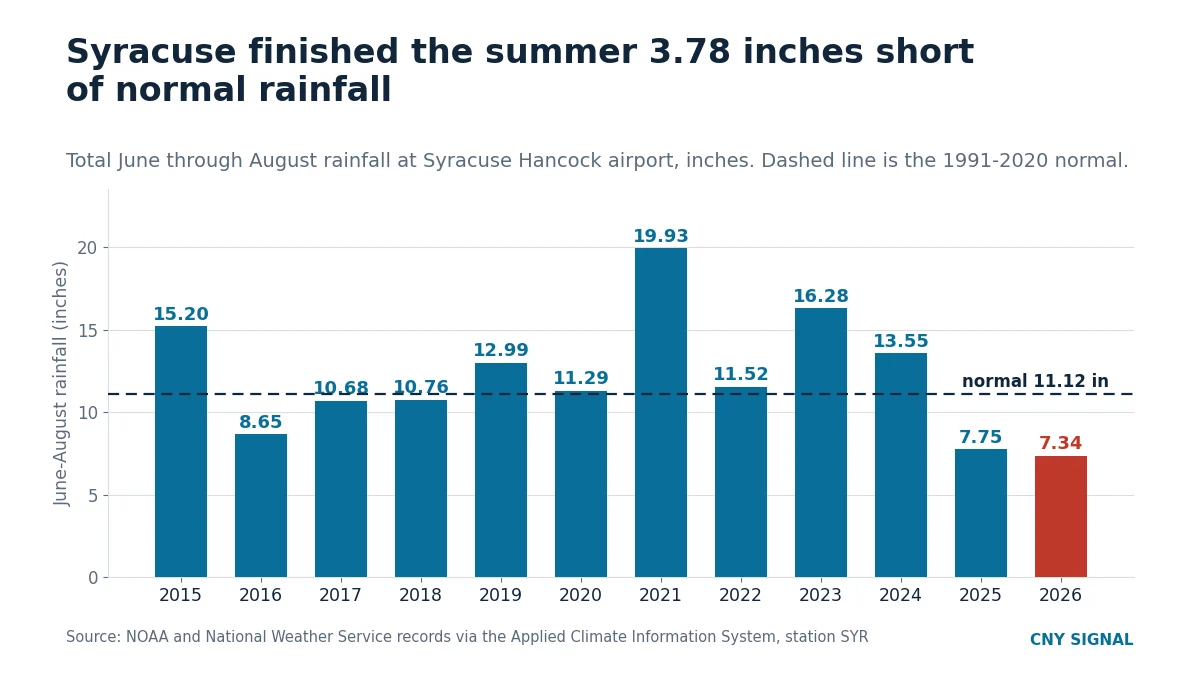
Syracuse closed out meteorological summer, June through August, with 7.34 inches of rain measured at Hancock International Airport. That is 3.78 inches short of the 1991-2020 normal of 11.12 inches, making it the 14th-driest summer since Syracuse’s weather station began its run of complete June-through-August records in 1950, one of 77 summers on the books, according to National Weather Service data compiled through the Applied Climate Information System.
This story came from public records we pulled ourselves
Get the next one, plus overnight incidents, in your inbox at 6 AM. Free, no spam.
Temperature was not the story this year. The season averaged 70.95 degrees, less than a degree above the 1991-2020 mark and the 17th-warmest summer on record. Rain was.
June was normal. Then it stopped.
The shortfall did not spread evenly across the season. June brought 4.01 inches, close to a typical opening month of summer. July and August did not follow: July produced 1.87 inches and August 1.46 inches, a combined 3.33 inches across two months that together usually account for most of a summer’s rain. June alone outproduced the next two months combined.
The second dry summer in a row
This was not a one-summer dip. Last year’s summer brought 7.75 inches, meaning Syracuse has now had back-to-back summers under 8 inches of rain. In 77 years of record, that has happened only twice before: in 1952 and 1953, and in a four-summer run from 1963 through 1966, when every summer that stretch came in between 5.33 and 7.46 inches. This is the third time Syracuse has strung together consecutive summers that dry.
None of the past decade’s summers came close to the all-time driest list, and neither did this one, though it came closer than any of them. The driest summers on record remain 1965 (5.33 inches), 1999 (5.35), 1960 (5.58) and 1953 (5.83). This year’s 7.34 inches missed the 10th spot on that list, held by 1985 at 6.99 inches, by just 0.35 inches.
Not a drought, officially
None of this has triggered a drought designation. The U.S. Drought Monitor’s most recent map, valid Aug. 25, lists Onondaga County at zero percent across every category, from “abnormally dry” through “exceptional drought,” with no change recorded over the previous week or the previous month, according to drought.gov, the federal portal that publishes the monitor’s county-level data. New York’s Department of Environmental Conservation runs its own four-level advisory system, watch, warning, emergency and disaster, separate from the federal monitor. It currently lists only its Region I, Nassau and Suffolk counties on Long Island, under a drought warning, the second of those four levels. As of the state’s current-conditions page, checked Sept. 2, Central New York does not appear under a watch, warning, emergency or disaster designation of any kind.
There is a measurable effect on at least one local waterway. At the U.S. Geological Survey’s streamgage on Onondaga Creek at Dorwin Avenue in Syracuse, daily flow over the final week of August averaged about 24.5 cubic feet per second. That is roughly 58 percent of the 42.4 cfs average recorded on those same seven calendar days across 74 years of gauge records, from 1951 through 2025.
Put together, the two records describe a summer that ran dry by the numbers, dry enough to show up in a nearby creek, but not dry enough, so far, to cross into an official drought.
Sources
- Summer 2026 climate summary for Syracuse Hancock International Airport (station SYR / KSYR), National Weather Service data via Applied Climate Information System (ACIS), Northeast Regional Climate Center. https://xmacis.rcc-acis.org
- Onondaga County drought status, U.S. Drought Monitor data as published by the National Integrated Drought Information System, data valid Aug. 25, 2026. https://www.drought.gov/states/new-york/county/onondaga
- Current Drought Conditions, New York State Department of Environmental Conservation, checked Sept. 2, 2026. https://dec.ny.gov/environmental-protection/water/water-quantity/drought/current-drought-conditions
- Onondaga Creek at Dorwin Avenue, Syracuse NY (USGS site 04239000), daily and instantaneous discharge data and historical daily statistics, U.S. Geological Survey National Water Information System. https://waterdata.usgs.gov/monitoring-location/USGS-04239000/
Every figure in this story is drawn from the records above. Links go to the primary documents.