The 2020 census counted 148,620 people in Syracuse, the city’s first decennial gain since 1930. Vintage 2025 estimates released in May put the city at 144,896, and the tug of war between international arrivals, downtown apartments, and Micron’s fabs will decide what the 2030 count looks like.
For 90 years, every decennial census delivered Syracuse the same verdict: smaller. From a peak of 220,583 residents in 1950, the city shed people decade after decade until the count bottomed out at 145,170 in 2010, a loss of 75,413 residents, or 34.2 percent of the city at its height. Then the 2020 census counted 148,620 people inside the city line, a gain of 3,450 residents, up 2.4 percent from 2010 and the first increase recorded in a decennial census since 1930.
This story came from public records we pulled ourselves
Get the next one, plus overnight incidents, in your inbox at 6 AM. Free, no spam.
Whether that gain marked a true inflection point or a one-time blip is now the central demographic question in Central New York, and the newest federal numbers cut both ways. The Census Bureau’s Vintage 2025 estimates, released May 14, 2026, put Syracuse at 144,896 as of July 1, 2025, a slow drift downward. But the same dataset shows the engine that could reverse it: net international migration into Onondaga County more than quadrupled between fiscal 2021 and fiscal 2024, from 507 people to 2,139, before Washington’s refugee freeze cut the flow.
The CNY Signal Data Desk pulled the Census Bureau’s full 2020 to 2025 estimate files for the city and county, the county’s Housing Onondaga needs assessment, Downtown Committee of Syracuse figures, and state refugee arrival data to map where Syracuse’s population actually stands, and what has to go right for the 2030 census to confirm the turnaround.
Seven decades of decline, measured in 75,413 people
The scale of what Syracuse lost is easy to forget. The 1950 census counted 220,583 people in the city, the high-water mark of a century of industrial growth. Every count after that came in lower: 216,038 in 1960, 197,208 in 1970, 170,105 in 1980, 163,855 in 1990, 146,070 in 2000, and 145,170 in 2010, according to decennial census figures compiled in Onondaga County’s Housing Onondaga assessment.
The 1970s were the worst single decade. Syracuse lost 27,103 residents between the 1970 and 1980 counts, an average of more than 2,700 people every year for ten years. The county’s own housing consultants, czb LLC, described the mechanics bluntly in the June 2024 Housing Onondaga report: after 1970, Onondaga County as a whole stopped growing, and suburban growth in the towns and villages came almost entirely from Syracuse residents moving out of the city. The county’s urbanized footprint sprawled from 44 square miles in 1950 to 186.6 square miles in 2020 even as the total population barely moved.
That is what makes 2020 different. The gain of 3,450 people was small, but it was the first time in nine decades that the city grew between counts while the suburbs also grew. Towns and villages outside Syracuse counted 327,896 people in 2020, and the county as a whole reached 476,516.
What the newest estimates actually say
The annual estimates released this spring complicate the celebration. In the Vintage 2025 sub-county file, Syracuse’s estimated population runs 145,645 in July 2021, 146,196 in 2022, 145,716 in 2023, 145,402 in 2024, and 144,896 in 2025. That is a decline of 749 people over four years, roughly 187 a year, or about 0.13 percent annually.
Two things are true at once. First, the city is not growing in the current estimates. Second, the bleed is nothing like the old freefall: the 1970s pace of decline was about 14 times faster than the 2021 to 2025 pace. Demographers would call this stabilization, and it is happening in a hostile decade for Northeastern cities. The Census Bureau’s May 14 release noted that cities of 50,000 or more in the Northeast grew just 0.2 percent on average between 2024 and 2025, and New York City alone lost 12,196 people, the largest numeric drop in the nation.
City estimates also have a documented history of undercounting Syracuse. The Bureau’s own estimates had Syracuse at 146,396 in 2017 and drifting down, right before the 2020 census counted 148,620. If the current estimates are missing new residents in converted downtown buildings and refugee households on the north side, the same surprise could repeat in 2030.
Onondaga County’s estimate stands at 466,584 for July 2025, down 9,932 from the 2020 census count of 476,516, a 2.1 percent decline over five years.
The engine of stabilization is international migration
The county components-of-change file tells the clearest story in the entire dataset. Onondaga County’s net international migration climbed every year from fiscal 2021 through fiscal 2024: 507 people in 2021, 1,307 in 2022, 1,843 in 2023, and 2,139 in 2024. Over the five years through 2025, international arrivals added 7,238 people to the county.
Domestic migration ran the other way the entire time, with a net 14,665 people leaving Onondaga County for elsewhere in the United States over the same five years, including a net loss of 2,284 in fiscal 2024, the smallest outflow of the period. In fiscal 2024 the two flows nearly canceled: total net migration was just negative 145, the closest the county has come to migration balance this decade.
Natural change is a shrinking drag. The county recorded 4,523 births against 4,698 deaths in fiscal 2024, a natural decrease of 175, and the gap narrowed from 381 in 2021 to 140 in 2025 as pandemic-era death rates receded.
Then the engine sputtered. Net international migration fell to 1,442 in fiscal 2025, a 33 percent drop from the 2024 peak, after the federal government halted refugee admissions in early 2025. Total county population change swung from a loss of 351 people in fiscal 2024 to a loss of 1,589 in fiscal 2025.
Refugee resettlement built the pipeline
Syracuse has resettled refugees for more than 40 years, and the recent numbers rank it among the most significant resettlement destinations in New York relative to its size. Onondaga County welcomed more than 10,000 refugees over the most recent decade, according to CNY Vitals, arriving from countries including Bhutan, Burma, Somalia, Syria, Afghanistan, Ukraine, and the Democratic Republic of Congo.
In 2025, even with the federal freeze taking hold partway through the year, 945 refugees were resettled in Onondaga County, more than a quarter of all refugees placed anywhere in New York State that year, according to state resettlement data reported by Central Current. The same reporting found 6,128 refugees across 1,940 cases in the county now stand to lose SNAP benefits by May 2027 under new federal eligibility rules, a measure of how large the resettled community has become.
The economic footprint is measurable. Immigrants made up 7 percent of the combined population of Onondaga, Oswego, and Madison counties in 2023 and held an estimated $1.3 billion in spending power, per CNY Vitals. Inside the city, the foreign-born share of the population rose from 11.6 percent in 2023 to 12.3 percent, about 18,000 people, in the most recent American Community Survey data compiled by Data USA. More than 70 languages are spoken in the Syracuse City School District.
Downtown: 4,400 residents where about 2,100 lived in 2010
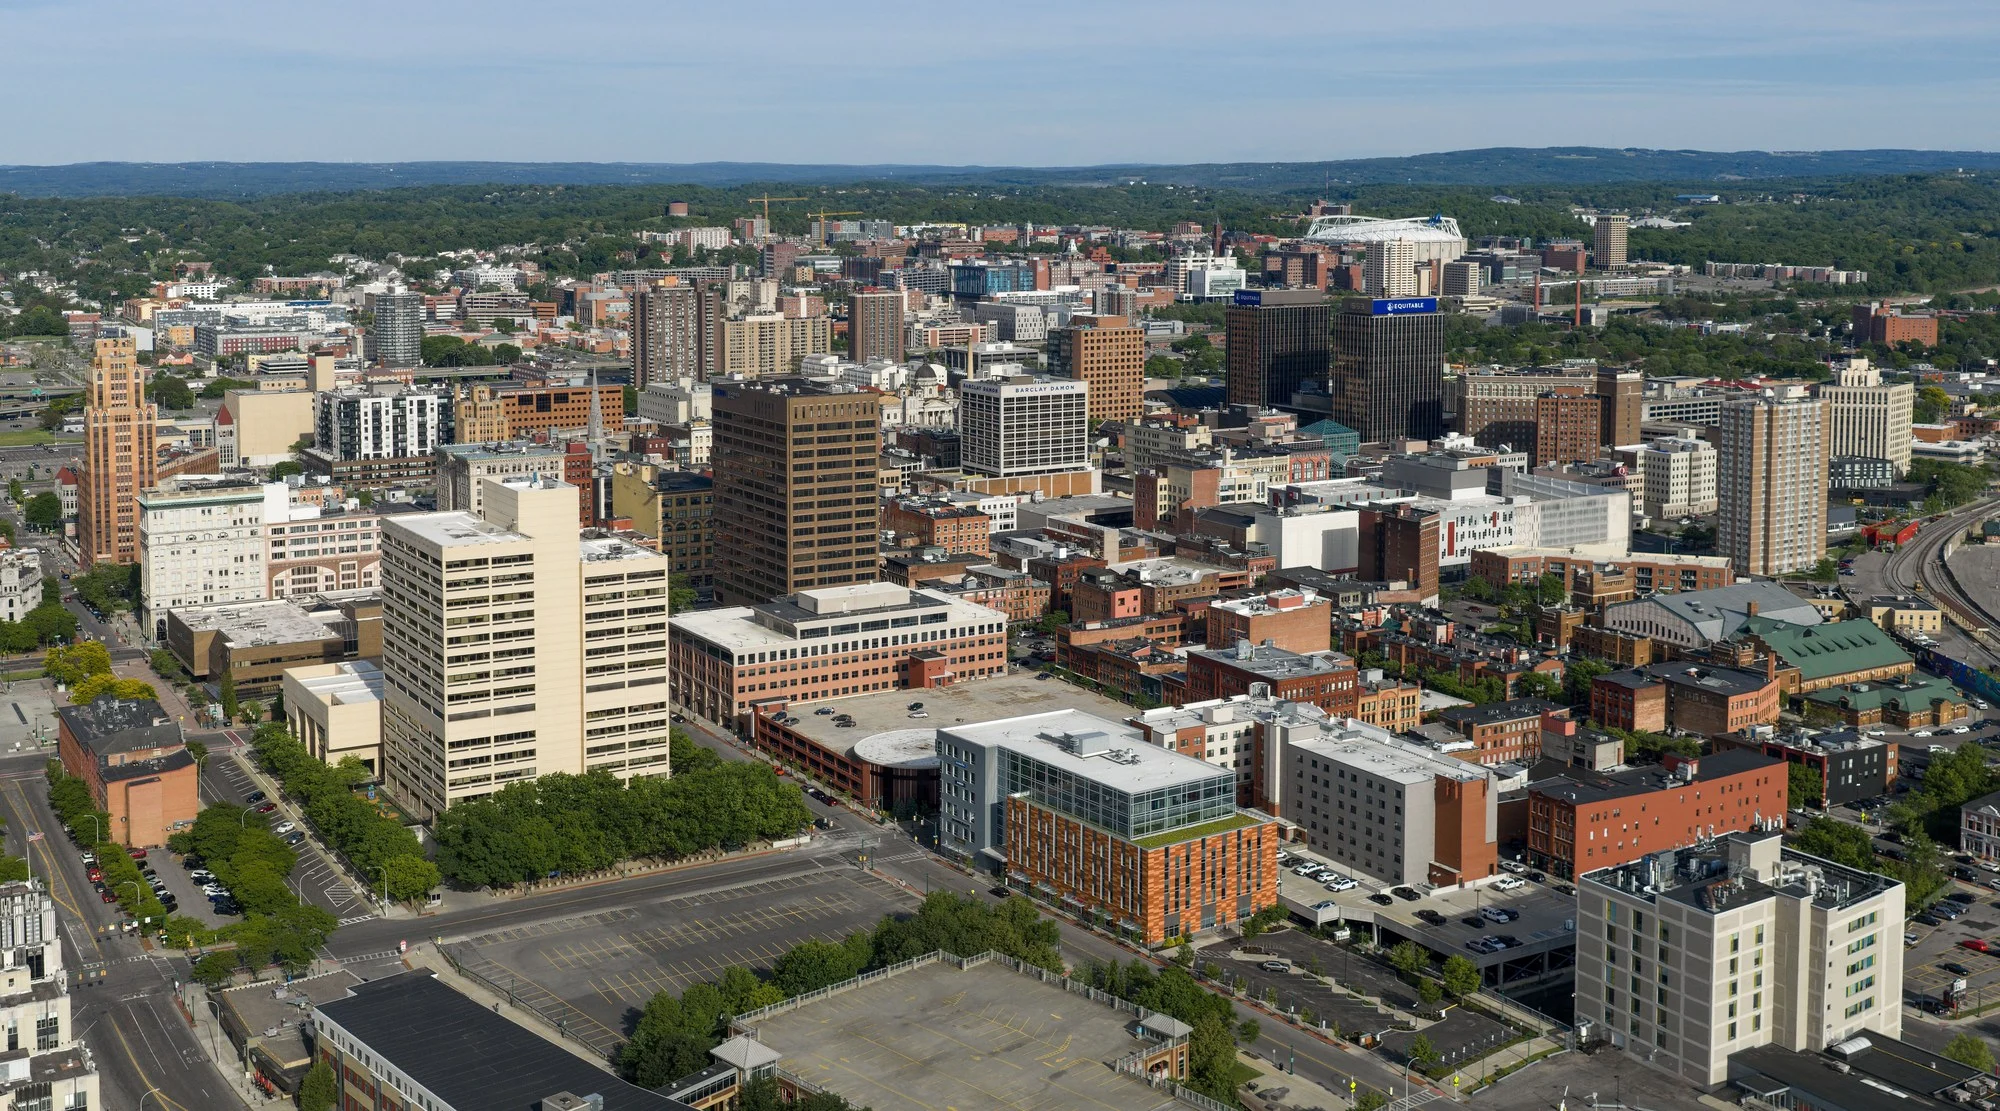
If international migration is the volume story, downtown is the momentum story. The Downtown Committee of Syracuse counted 4,400 downtown residents as of summer 2025, a 114 percent increase since 2010. Developers have completed 1,597 housing units downtown since 2010, backed by $443 million in housing investment, and more than 700 additional apartments are under construction or in the pipeline. Residential occupancy stands at 96 percent.
The people filling those units skew young and educated: the average downtown resident is 31 years old, and 56.2 percent hold at least a bachelor’s degree. Average asking rent runs $1,382 for a one-bedroom and $1,889 for a two-bedroom. A 2025 housing needs assessment prepared for the Downtown Committee by CommunityScale found the market could absorb roughly 176 new units per year while keeping vacancy under 7 percent, and that half of new downtown residents arrive from outside Onondaga County, meaning downtown growth is importing people, not just shuffling them from other city neighborhoods.
The Micron variable hangs over every projection
Every forward-looking number for Onondaga County now bends around one project: Micron Technology’s plan to invest up to $100 billion over 20-plus years in a four-fab memory chip campus in Clay, the largest single private investment in New York history. Micron and the Onondaga County Office of Economic Development put the employment math at roughly 9,000 direct Micron jobs and more than 40,000 additional community jobs among suppliers, contractors, and supporting businesses, close to 50,000 New York jobs in all. Construction crossed a visible threshold with the first concrete pour at the Clay site in early 2026.
The demographic implications are spelled out in Housing Onondaga, the county’s June 2024 housing needs assessment. With Micron’s arrival, the county “is positioned to add well over 30,000 new residents by 2040,” and county households could grow by almost 25,000 over the same period. The report’s consultants at czb LLC estimate housing demand attributable to Micron at 20,000 to 25,000 households, and projections from New York State’s economic development agency cited in the report suggest the five-county Central New York area could hold 60,000 additional residents in 2040 beyond its baseline path. County officials have said Onondaga County needs to add roughly 1,300 housing units a year to stay ahead of that growth.
For the city itself, the stakes are direct: Housing Onondaga argues new development should be concentrated in existing centers, with villages and the City of Syracuse named first among them. A county that adds 30,000 people while the city adds none would repeat the 1970 to 2020 pattern. A city that captures even a fifth of that growth would post its largest census gain since the 1920s.
Where to track this
The next hard checkpoint is the Census Bureau’s Vintage 2026 estimates, due for counties in spring 2027 and for cities in late spring 2027, which will show the first full year of the refugee freeze and the first year of heavy Micron construction employment. Readers can follow the same sources the Data Desk used: the Census Bureau’s city and town population totals page (census.gov/programs-surveys/popest), the county components-of-change files that break out international and domestic migration, CNY Vitals’ People dashboard for resettlement and demographic trends, the Downtown Committee’s downtown stats page for the residential pipeline, and housingonondaga.org for the county’s growth planning. CNY Signal will re-run this analysis when each new vintage drops.